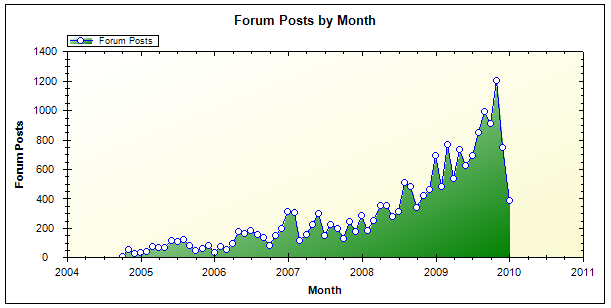
The volume of forum posts in the mojoPortal forums was growing rapidly. ZedGraph, which is used to make charts in some mojoPortal features, allows us to make a chart to show the forum posts per month. After implementation of the Query Tool, one of the first things done is to write and save a query that has the statistics for forum posts by month. The MySQL syntax for the query would be:
SELECT
YEAR(PostDate) AS Y,
MONTH(PostDate) AS M,
CONCAT(YEAR(PostDate), '-', MONTH(PostDate)) AS Label,
COUNT(*) AS Posts
FROM mp_forumposts
GROUP BY YEAR(PostDate), MONTH(PostDate)
ORDER BY YEAR(PostDate), MONTH(PostDate);
All that is needed is to make a simple SiteModule Control with a ZedGraph chart, and use my saved query to populate it. The final result looks like this:

The "Live" version can be seen in action on our Community page.
The feature is built using a simple .ascx file with inline code and installed as discussed in our Hello World examples. This is not the way a complex feature should be implemented, but for this simple chart it was pretty handy.
Create a text file named ForumStats.ascx and paste in the code below for the complete solution. Of course if you are not using MySql you will need different syntax for your query, but similar query can be easily accomplished with any of the supported database platforms.
Here is the full code of my controls:
<%@ Control Language="C#" ClassName="ForumStatsChart.ascx" Inherits="mojoPortal.Web.SiteModuleControl" %>
<%@ Register TagPrefix="zgw" Namespace="ZedGraph.Web" Assembly="ZedGraph.Web" %>

<%@ Import Namespace="System" %>
<%@ Import Namespace="System.Data" %>
<%@ Import Namespace="System.Data.Common" %>
<%@ Import Namespace="System.Drawing" %>
<%@ Import Namespace="mojoPortal.Business" %>
<%@ Import Namespace="mojoPortal.Business.WebHelpers" %>
<%@ Import Namespace="mojoPortal.Web.Framework" %>
<%@ Import Namespace="mojoPortal.Web.Controls" %>
<%@ Import Namespace="mojoPortal.Web.Editor" %>
<%@ Import Namespace="mojoPortal.Net" %>
<%@ Import Namespace="ZedGraph" %>
<%@ Import Namespace="ZedGraph.Web" %>

<script runat="server">

    private SiteSettings siteSettings;

    protected override void OnInit(EventArgs e)
    {
  base.OnInit(e);

        UserChart.RenderGraph += new ZedGraph.Web.ZedGraphWebControlEventHandler(this.OnRenderUserChart);
        siteSettings = CacheHelper.GetCurrentSiteSettings();
  // tell ZedGraph where to store the generated chart image
        UserChart.RenderedImagePath = "~/Data/Sites/" + siteSettings.SiteId.ToString()
            + "/systemfiles/";

    }

    protected void Page_Load(object sender, EventArgs e)
    {
        LoadSettings();
        PopulateLabels();
        PopulateControls();
    }

    private void OnRenderUserChart(ZedGraph.Web.ZedGraphWeb z, System.Drawing.Graphics g, ZedGraph.MasterPane masterPane)
    {
  SavedQueryRespository repository = new SavedQueryRespository();
  // we can fetch a saved query by name or guid
  SavedQuery q = repository.Fetch("ForumStats");
  if(q == null){ return; }
        // Get the GraphPane so we can work with it
        GraphPane graphPane = masterPane[0];

        // Set the titles and axis labels
        graphPane.Title.Text = "Forum Posts by Month";
        graphPane.XAxis.Title.Text = "Month";
        graphPane.YAxis.Title.Text = "Forum Posts";

        PointPairList pointList = new PointPairList();
        // here we pass in the sql statement from the saved query
  // the first parameter allows us to override the connection string if we want to
        using(IDataReader reader = DatabaseHelper.GetReader(string.Empty, q.Statement))
  {
   while (reader.Read())
   {
    double x = new XDate(Convert.ToInt32(reader["Y"]), Convert.ToInt32(reader["M"]),1);
    double y = Convert.ToDouble(reader["Posts"]);
    pointList.Add(x, y);
   }
        }

        // Generate a blue curve with circle symbols, and "My Curve 2" in the legend
        LineItem myCurve2 = graphPane.AddCurve("Forum Posts", pointList, Color.Blue,
                                SymbolType.Circle);
        // Fill the area under the curve with a white-red gradient at 45 degrees
        myCurve2.Line.Fill = new Fill(Color.White, Color.Green, 45F);
        // Make the symbols opaque by filling them with white
        myCurve2.Symbol.Fill = new Fill(Color.White);

        // Set the XAxis to date type
        graphPane.XAxis.Type = AxisType.Date;
        graphPane.XAxis.CrossAuto = true;

        // Fill the axis background with a color gradient
        graphPane.Chart.Fill = new Fill(Color.White, Color.LightGoldenrodYellow, 45F);

        masterPane.AxisChange(g);
    }

    private void LoadSettings()
    {
        Title1.Visible = !this.RenderInWebPartMode;
        if (this.ModuleConfiguration != null)
        {
            this.Title = this.ModuleConfiguration.ModuleTitle;
            this.Description = this.ModuleConfiguration.FeatureName;
        }
    }

</script>

<mp:CornerRounderTop id="ctop1" runat="server" />
<asp:Panel ID="pnlWrapper" runat="server" CssClass="panelwrapper linksmodule">
<portal:ModuleTitleControl id="Title1" runat="server" />
<asp:Panel ID="pnlUserChart" runat="server" EnableViewState="false" CssClass="modulecontent">
         <ZGW:ZEDGRAPHWEB id="UserChart" runat="server" RenderMode="ImageTag"
            Width="600" Height="300"></ZGW:ZEDGRAPHWEB>
</asp:Panel>
<div class="modulefooter"></div>
</asp:Panel>
<mp:CornerRounderBottom id="cbottom1" runat="server" />
Last Modified by Joe Davis on Aug 19, 2022